First-class Kubernetes integration for Vector
Vector is now the backbone of observability on Kubernetes
After months of development, over 100 pull requests, and intensive QA in clusters producing over 20 terabytes of event data a day, we’re pleased to announce our first-class Kubernetes integration for Vector in version 0.11. We strove to make even this initial integration rock solid and production ready because we aim to make Vector the default pipeline for all Kubernetes observability data.
To cut straight to the chase, checkout the installation instructions, otherwise read on for the details.
A new source for Kubernetes log data
The crux of our Kubernetes integration for Vector is the new kubernetes_logs source. This source does all of the following:
- Automatically collects logs from all Nodes in your cluster
- Automatically merges logs that are split due to the 16kb limit imposed by Docker
- Communicates with the Kubernetes API to enrich logs with Kubernetes metadata, including:
- Container name and image
- Pod uid, name, namespace, and labels
- Node name
- Provides robust filtering options for including and excluding Pods and individual containers within Pods
This simple Vector configuration, for example, would suffice to send logs from all of your Nodes/Pods to Elasticsearch:
sources:
  k8s_all:
    type: "kubernetes_logs"

sinks:
  es_out:
    type: "elasticsearch"
    inputs: ["k8s_all"]
    host: "http://your-elasticsearch-cluster:9200"
    index: "vector-k8s-%F"
Using this simple topology as a starting point, you can transform your log data in a wide variety of ways, ship it to other sinks, and much more.
Adaptive concurrency
Vector 0.11 also includes a feature called Adaptive Request Concurrency (ARC). ARC uses a battle-tested algorithm to automatically optimize concurrency limits for HTTP sinks based on downstream service responses. The benefit of ARC is that it enables you to safely move beyond static rate limiting when using systems like Elasticsearch and Clickhouse. Simply enable ARC with a single line of configuration and you can fully utilize your services’ bandwidth while ensuring that Vector doesn’t over-tax those systems.
ARC isn’t specific to Kubernetes but it is particularly useful in highly elastic Kubernetes environments, where static rate limiting runs the risk of underutilizing system resources and/or jeopardizing system reliability. For more info on ARC, check out our announcement post.
Installing Vector in your Kubernetes cluster
To install Vector in your Kubernetes cluster, check out our Kubernetes installation documentation, which includes instructions for:
Both installation options enable you to easily deploy Vector agents to your Nodes. In an upcoming release, we’ll also provide support for deploying Vector as a centralized aggregator.
Why Vector for your Kubernetes cluster?
We all know that the Kubernetes ecosystem is packed with options. The now-infamous CNCF landscape includes over 90 observability tools. Amidst such plenty, it’s not surprising that many Kubernetes clusters run multiple observability tools side by side, often on the same Node or even in the same Pod. But when you run ever-more resource-hungry processes side by side, that can lead to agent fatigue, a costly problem that Vector tackles head-on.
To give a real-world example of agent fatigue, let’s look at a telecom enterprise before and after adopting Vector.
Before Vector
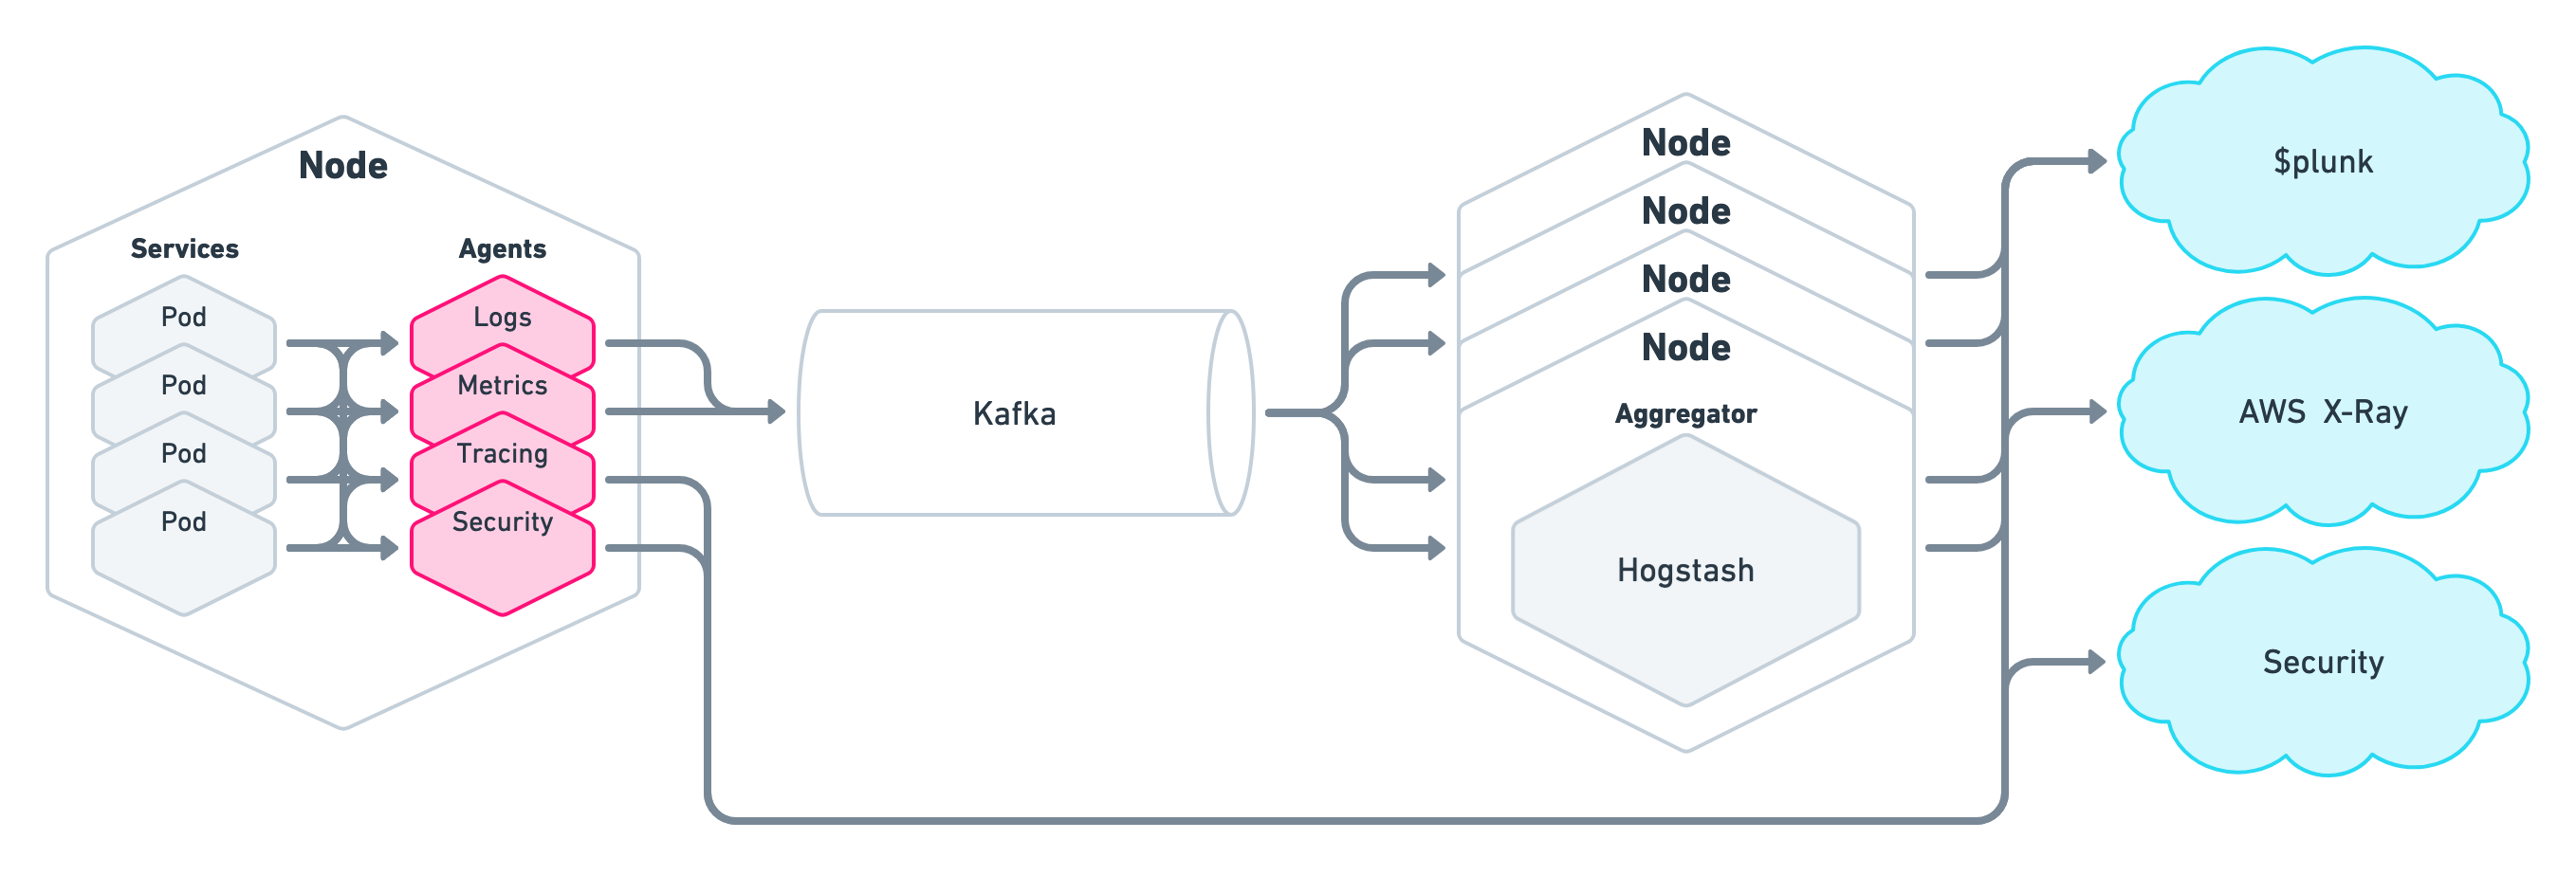
Prior to adopting Vector, the company deployed four or more agents (!) on each of their Kubernetes Nodes:

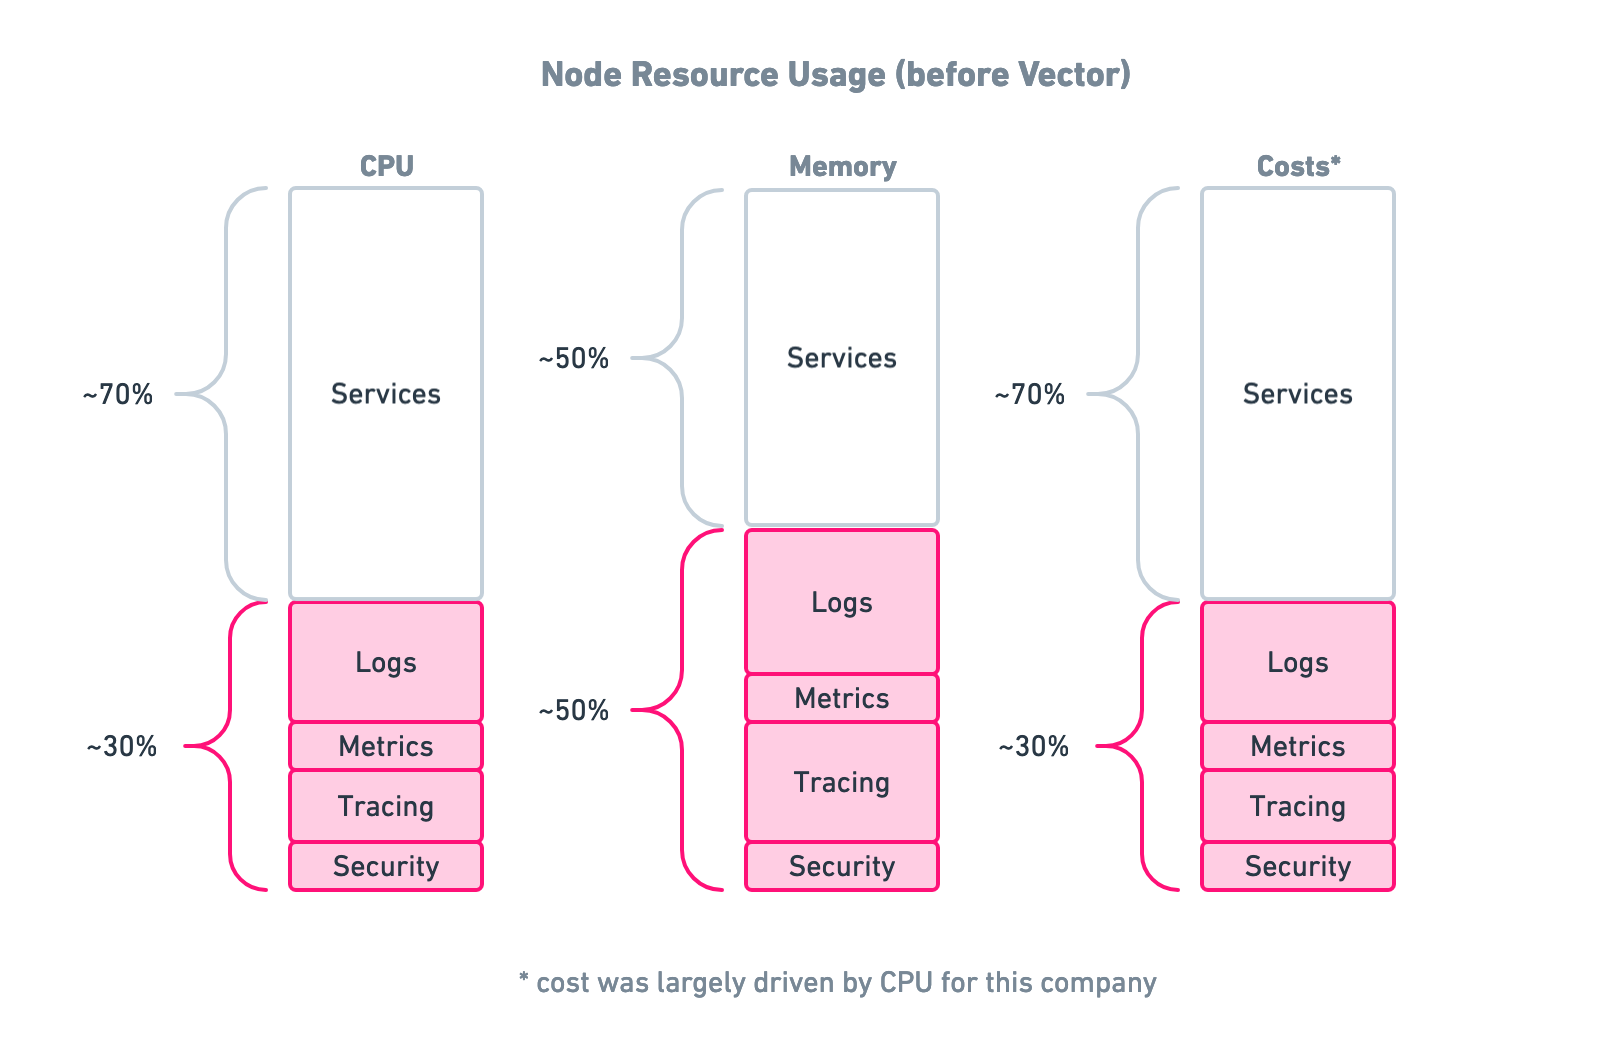
That’s one agent for each of the following: logs, metrics, traces, and security (e.g. breach detection). And then on top of four agents per Node, they needed to run a cluster of observability data aggregators for cross-Node analysis and batching/archiving as well as a Kafka cluster in front of those aggregators (to address reliability and durability concerns).
All together, those four agents consumed ~30% of the Node’s computing resources, while Kafka/aggregator combination was the company’s largest services in terms of resource usage (what!?). In total, a whopping ~40% of their resources were dedicated to observability infrastructure. And this resource intensity doesn’t even include in the engineering time and effort required to deploy and manage all of it:

Although this is an extreme case, we’d bet that you can relate to some—though hopefully not all!—of these troubles. What makes this problem so pernicious is that it happens over time. This heavy resource usage was not the result of an elaborate master plan by these engineers; it was the byproduct of evolving company needs, fast-paced engineering, fragmentation in the observability space, and vendor lock-in. That last one can be a real killer.
After Vector
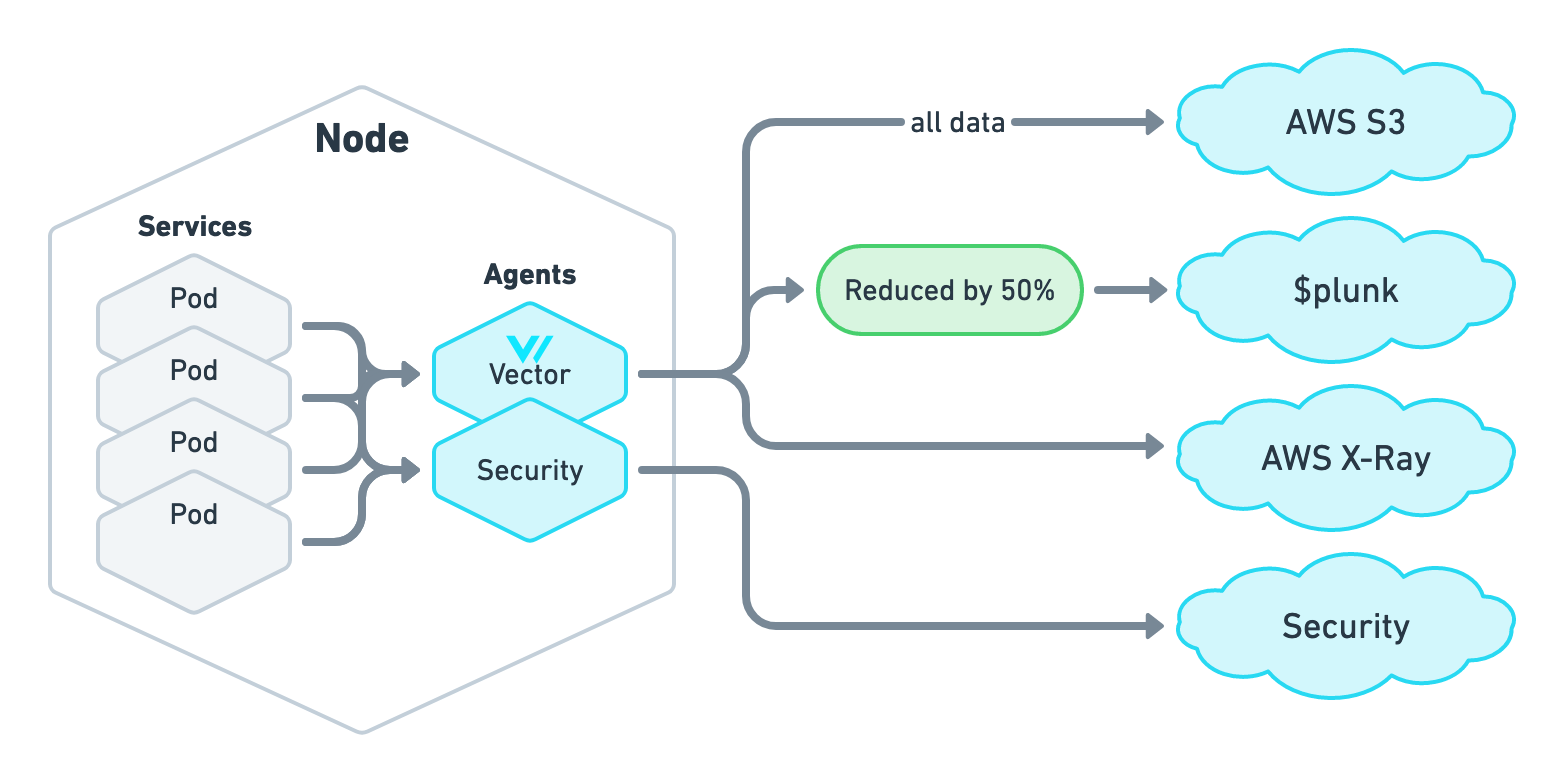
By switching to Vector, the telecom company from the “before” scenario was able to consolidate the logs, metrics, and tracing agents:

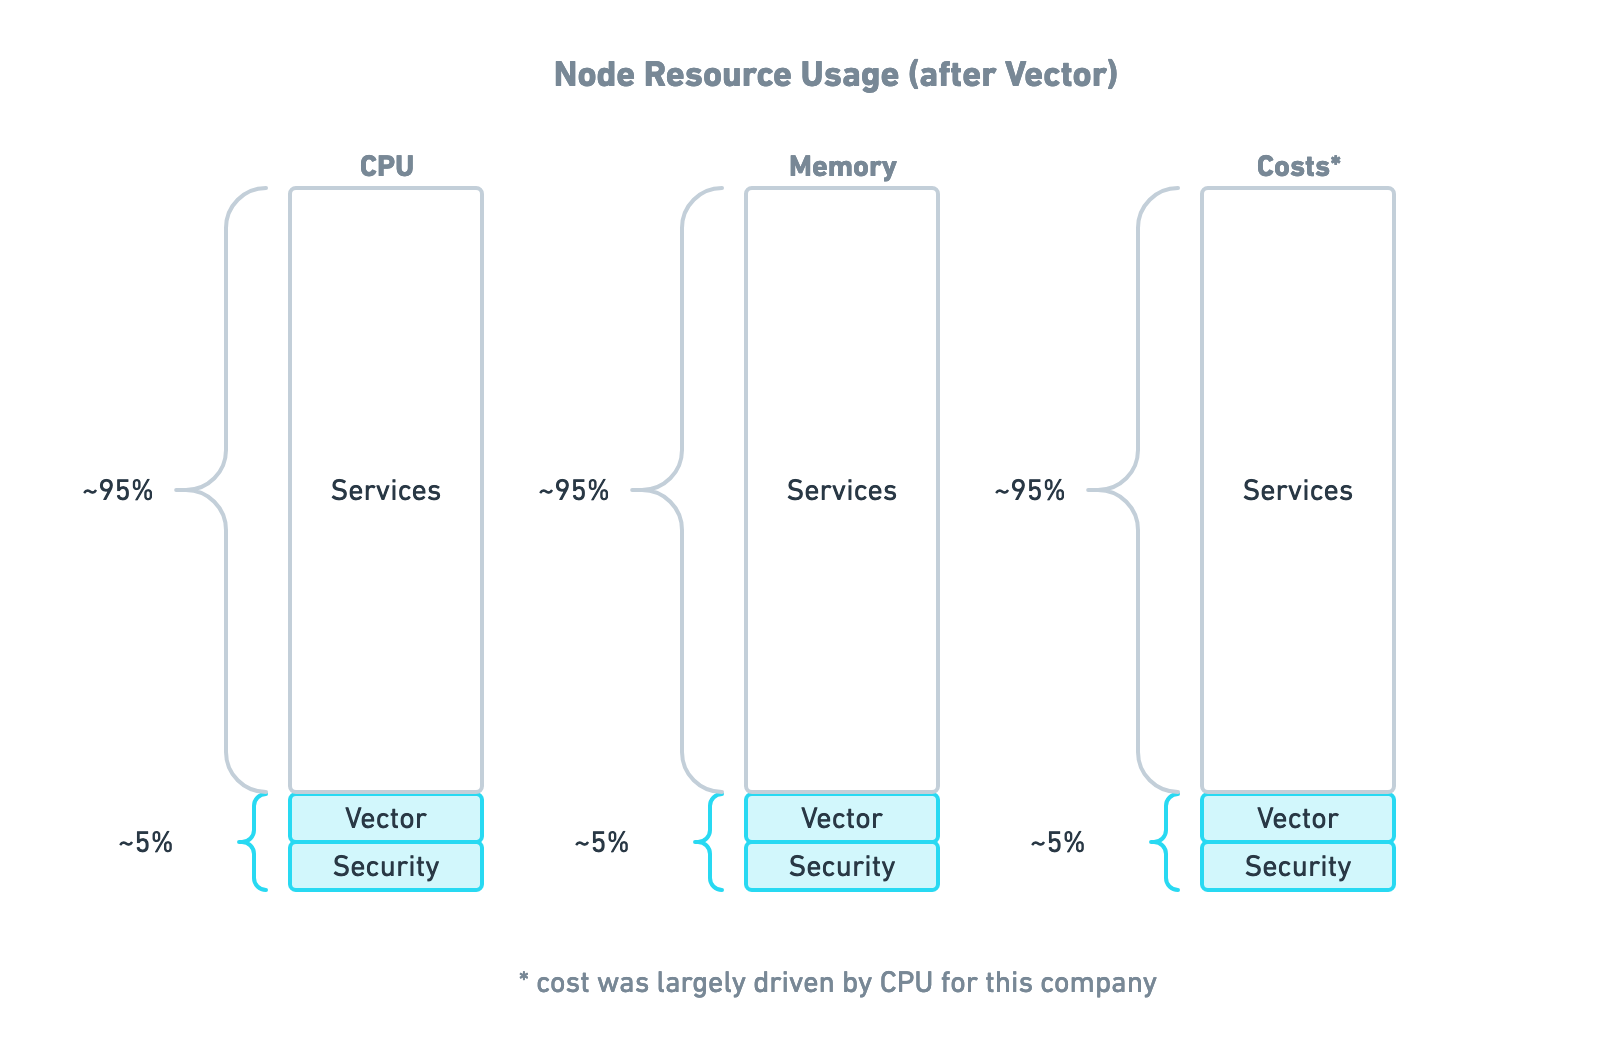
This reduced observability resource usage by 90%. This brought resource usage from 40% of the total down to 5%. In addition, Vector reduced Splunk data volume through sampling and cleaning, afforded by using AWS S3 as the system of record. All in all, Vector significantly reduced the overall observability costs. The result looked like this:

To summarize, adopting the new Vector-based architecture meant:
- One observability tool
- One workflow to deploy and manage that tool
- Reduced infrastructure cost
- Reduced Splunk cost
- Reduced engineering and operations time
- Reduced lock-in, as the company can now modify their observability setup by re-configuring Vector rather than swapping out agents
More to come
We’re confident that this initial integration is up to the task of dramatically reducing observability costs and headaches in your Kubernetes cluster. But we do have more on the way here, including native tracing support for OpenTelemetry-compliant traces and a variety of new Prometheus-related features.
We want Vector to become the backbone of observability in Kubernetes. If you share our vision of a single, ultra-fast, ultra-reliable, open-source observability platform, give us a try! As a user-first company, our entire engineering team is actively engaged with our community and eager to work with you.
