A guide for debugging Vector pipelines
Step by step guide for debugging pipelines

Debugging Guide
This guide will describe an imaginary use case and how to progressively resolve issues using command line tools and Vector commands.
Imagine we have two sources, and we want to assign group IDs to Vector logs based on the source. Finally, we want to send those modified logs to an HTTP server for further processing and/or storage.
In the following sections we will examine the tools we have at our disposal.

Controlling Log Verbosity
Use the VECTOR_LOG environment variable to control log verbosity:
VECTOR_LOG=debug vector --config path/to/config.yaml
You can set different verbosity levels for specific components:
VECTOR_LOG=info,vector::sources::aws_s3=warn vector --config path/to/config.yaml
You can find more information on the syntax here.
Vector Tools
Vector top
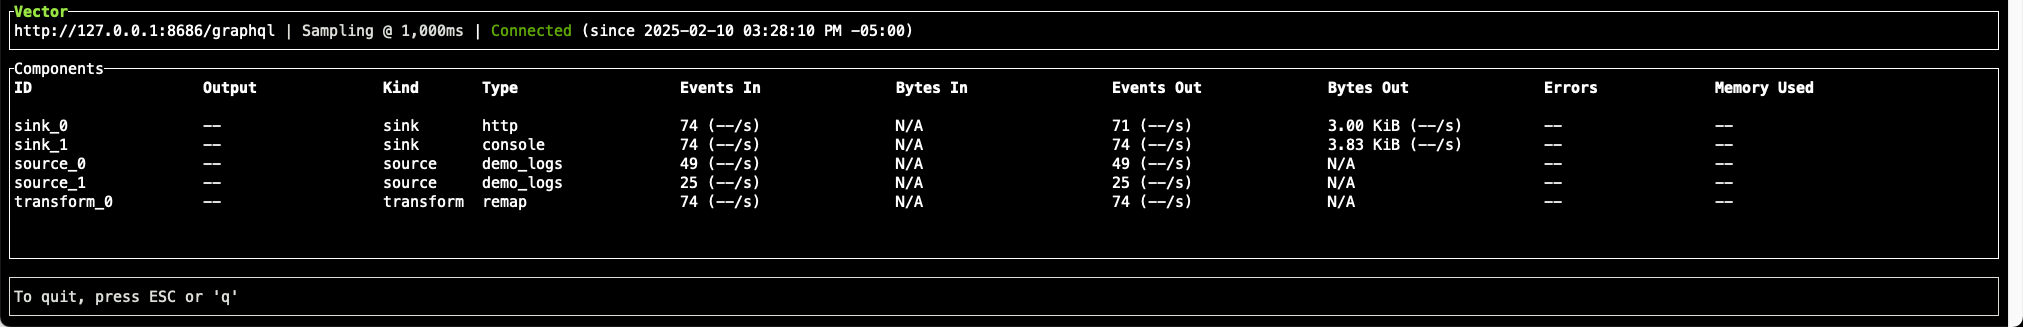
Use vector top to display topology and metrics in the console. For example, you can inspect how many events are produced by sources vs how many events reach the sinks.
Command:
vector top
Screen:
The internal metrics source
The internal_metrics source can be used to inspect component metrics in detail.
For example, you can connect this source to a sink and collect the internal metrics:
data_dir: /var/lib/vector/
sources:
  source0:
    type: internal_metrics
    scrape_interval_secs: 1.0

sinks:
  sink0:
    type: prometheus_exporter
    inputs:
      - source0
    address: 0.0.0.0:9598
Vector Tap
With vector tap you see the input and/or outputs of your components. Here, it is worth mentioning a caveat, sinks don’t have outputs thus we cannot tap them. This means we cannot inspect actual payloads that are sent downstream.
Command:
vector tap --outputs-of source_0,transform_0
Screen:

Console
Note that the console sink can also be very useful here. For example:
my_console_sink:
  type: console
  inputs:
    - my_source_0
    - my_source_1
  encoding:
    codec: json
    json:
      pretty: true
Python HTTP Server
The following code implements a Python server that imitates a downstream system to which Vector publishes logs. We will use this server to demonstrate a few scenarios.
Code
👉 Click to expand the script 👈
import http.server
import socketserver
import json
import threading
import zlib
from http import HTTPStatus  # Import HTTP status codes

# Global variable for the response code
response_code = HTTPStatus.OK  # Default to 200 OK

class DebuggingHTTPRequestHandler(http.server.BaseHTTPRequestHandler):
  """
  HTTP server for debugging.

  - Responds with a dynamically controlled status code (default HTTPStatus.OK).
  - Supports GET, POST, PUT, DELETE, and other HTTP methods.
  - Allows changing the response code via a POST request to /set_status.
  - Logs request headers and JSON payloads (supports zlib-compressed payloads).
  """

  def do_GET(self):
      """Handles GET requests by returning the configured response code."""
      self.send_custom_response()

  def do_POST(self):
      """Handles POST requests. Logs request details before checking the path."""
      json_data = self.log_request_details()
      if self.path == "/set_status":
          self.set_status(json_data)
      elif self.path == "/logs":
          self.send_custom_response()

  def do_PUT(self):
      """Handles PUT requests."""
      self.send_custom_response()

  def do_DELETE(self):
      """Handles DELETE requests."""
      self.send_custom_response()

  def send_custom_response(self):
      """Send an HTTP response with the currently configured status code."""
      global response_code
      self.send_response(response_code)
      self.send_header("Content-type", "application/json")
      self.end_headers()
      response = {"status": response_code, "message": f"Responding with {response_code}"}
      self.wfile.write(json.dumps(response).encode())

  def log_request_details(self):
      """Logs headers and JSON payload for all POST requests before processing."""
      content_length = int(self.headers.get('Content-Length', 0))
      body = self.rfile.read(content_length)

      print("\n📥 Received POST request:")
      print(f"🔗 Path: {self.path}")
      print("📜 Headers:")
      for key, value in self.headers.items():
          print(f"   {key}: {value}")

      if self.headers.get('Content-Encoding') == 'gzip':
          print("❌ Error: Gzip compression is not supported.")
          self.send_response(HTTPStatus.BAD_REQUEST)
          self.send_header("Content-type", "application/json")
          self.end_headers()
          self.wfile.write(json.dumps({"error": "Gzip compression is not supported."}).encode())
          return None

      if self.headers.get('Content-Encoding') == 'deflate':
          try:
              body = zlib.decompress(body)
              print("🗜️ Payload was zlib-compressed. Decompressed successfully.")
          except zlib.error:
              print("❌ Error decompressing zlib payload.")
              self.send_response(HTTPStatus.BAD_REQUEST)
              self.send_header("Content-type", "application/json")
              self.end_headers()
              self.wfile.write(json.dumps({"error": "Invalid zlib-compressed data"}).encode())
              return None

      try:
          json_data = json.loads(body.decode())
          print("📦 JSON Payload:", json.dumps(json_data, indent=2))
          return json_data
      except json.JSONDecodeError:
          print("⚠️  No valid JSON payload received.")
          self.send_response(HTTPStatus.BAD_REQUEST)
          self.send_header("Content-type", "application/json")
          self.end_headers()
          self.wfile.write(json.dumps({"error": "Invalid zlib-compressed data"}).encode())
          return None

  def set_status(self, json_data):
      """Handles POST /set_status to update the response code dynamically."""
      global response_code

      if json_data is None:
          self.send_response(HTTPStatus.BAD_REQUEST)
          response = {"error": "Invalid request format. Send JSON with {'status': <code>}."}
      else:
          try:
              new_status = int(json_data.get("status", HTTPStatus.OK))
              if HTTPStatus.CONTINUE <= new_status <= HTTPStatus.NETWORK_AUTHENTICATION_REQUIRED:
                  response_code = new_status
                  self.send_response(HTTPStatus.OK)
                  response = {"message": f"Response code updated to {response_code}"}
              else:
                  self.send_response(HTTPStatus.BAD_REQUEST)
                  response = {"error": "Invalid status code. Must be between 100 and 599."}
          except ValueError:
              self.send_response(HTTPStatus.BAD_REQUEST)
              response = {"error": "Invalid status code format."}

      self.send_header("Content-type", "application/json")
      self.end_headers()
      self.wfile.write(json.dumps(response).encode())

def run_server(port):
  """Starts the HTTP server on the specified port."""
  handler = DebuggingHTTPRequestHandler
  with socketserver.TCPServer(("", port), handler) as httpd:
      print(f"🚀 Serving on port {port}")
      httpd.serve_forever()

if __name__ == "__main__":
  port = 8000
  server_thread = threading.Thread(target=run_server, args=(port,), daemon=True)
  server_thread.start()

  try:
      while True:
          pass
  except KeyboardInterrupt:
      print("\n🛑 Server shutting down.")
Description
This Python server is a simple HTTP debugging tool that:
- Responds to all HTTP methods with a configurable status code. For this guide, we focus on POST requests.
- Supports dynamic status code changes via POST /set_status. This allows us to imitate real world scenarios and demonstrate Vector retries.
- Logs all POST requests sent to /logs, including headers and JSON payloads.
- Handles both raw JSON and zlib-compressed JSON payloads. Rejects other payloads.
- By default, it starts on port 8000 and returns HTTP 200 OK unless modified.
Usage
Run command:
python3 fake_server.py
Change return status:
curl -X POST http://localhost:8000/set_status -H "Content-Type: application/json" -d '{"status": 404}'
Walkthrough
Initial Vector Config
👉 Click to view the whole config 👈
# version 1
api:
  enabled: true

sources:
  source_0:
    type: demo_logs
    format: shuffle
    lines:
      - '{ "key": "a", "property": "foo" }'
      - '{ "key": "b", "property": "bar" }'
    interval: 10

  source_1:
    type: demo_logs
    format: shuffle
    lines:
      - '{ "key": "c", "property": "some" }'
      - '{ "key": "d", "property": "another" }'
    interval: 10

  internal_metrics:
    type: internal_metrics
    scrape_interval_secs: 10

transforms:
  transform_0:
    type: remap
    inputs:
      - source_*
    source: |
      . = parse_json!(.message)
      if .key == "a" {
        .group = 0
      } else {
        .group = 1
      }

sinks:
  sink_0:
    inputs:
      - transform_0
    type: http
    uri: http://localhost:8000/logs
    encoding:
      codec: json
      json:
        pretty: true

  sink_1:
    type: console
    inputs:
      - internal_metrics
    encoding:
      codec: json
      json:
        pretty: true
Globals
api:
  enabled: true
Required by vector tap.
Sources
sources:
  source_0:
    type: demo_logs
    format: shuffle
    lines:
      - '{ "key": "a", "property": "foo" }'
      - '{ "key": "b", "property": "bar" }'
    interval: 10

  source_1:
    type: demo_logs
    format: shuffle
    lines:
      - '{ "key": "c", "property": "some" }'
      - '{ "key": "d", "property": "another" }'
    interval: 10
The above two sources emulate incoming events.
Transforms
transforms:
  transform_0:
    type: remap
    inputs:
      - source_*
    source: |
      . = parse_json!(.message)
      if .key == "a" {
        .group = 0
      } else {
        .group = 1
      }
This guide doesn’t focus on transforms like Remap. At this point, I would like to highlight https://playground.vrl.dev/ for quick iterations.
Sinks
  sink_0:
    inputs:
      - transform_0
    type: http
    uri: http://localhost:8000/logs
    encoding:
      codec: json
Vector Config with internal metrics
Full Config Preview
👉 Click to view the whole config 👈
# version 2
api:
  enabled: true

sources:
  source_0:
    type: demo_logs
    format: shuffle
    lines:
      - '{ "key": "a", "property": "foo" }'
      - '{ "key": "b", "property": "bar" }'
    interval: 10

  source_1:
    type: demo_logs
    format: shuffle
    lines:
      - '{ "key": "c", "property": "some" }'
      - '{ "key": "d", "property": "another" }'
    interval: 10

  internal_metrics:
    type: internal_metrics
    scrape_interval_secs: 10

transforms:
  transform_0:
    type: remap
    inputs:
      - source_*
    source: |
      . = parse_json!(.message)
      if .key == "a" {
        .group = 0
      } else {
        .group = 1
      }

sinks:
  sink_0:
    inputs:
      - transform_0
    type: http
    uri: http://localhost:8000/logs
    encoding:
      codec: json

  sink_1:
    type: console
    inputs:
      - internal_metrics
    encoding:
      codec: json
      json:
        pretty: true
You can run the config with the following command:
vector --config path/to/config.yaml
Description
Note that we added a new source:
  internal_metrics:
    type: internal_metrics
    scrape_interval_secs: 10
And a new sink:
  sink_1:
    type: console
    inputs:
      - internal_metrics
    encoding:
      codec: json
      json:
        pretty: true
Now we can observe internal metrics such as how many events our components receive:
{
  "name": "component_received_events_count",
  "namespace": "vector",
  "tags": {
    "component_id": "sink_0",
    "component_kind": "sink",
    "component_type": "http",
    "host": "MY_HOST"
  },
  "timestamp": "2025-02-12T15:58:03.723449Z",
  "kind": "absolute",
  "aggregated_histogram": {
    "buckets": [
      // ...
      {
        "upper_limit": 1.0,
        "count": 2
      },
      // ...
      {
        "upper_limit": "inf",
        "count": 0
      }
    ],
    "count": 2,
    "sum": 2.0
  }
}
Scenarios
In this section we will create some scenarios where the sink produces errors and we will show how to change the sink config to overcome them.
Scenario 1 - Unsupported Compression
Now that we have something that works, we want to add compression.
sinks:
  sink_0:
    inputs:
      - transform_0
    type: http
    uri: http://localhost:8000/logs
    encoding:
      codec: json
    compression: gzip
zlib payloads. We now observe the following metrics:{
"name": "component_errors_total",
"namespace": "vector",
"tags": {
"component_id": "sink_0",
"component_kind": "sink",
"component_type": "http",
"error_type": "request_failed",
"host": "MY_HOST",
"stage": "sending"
},
"timestamp": "2025-02-12T16:09:51.122851Z",
"kind": "absolute",
"counter": {
"value": 2.0
}
}
If we had access to the server downstream, we would see the following error:
📥 Received POST request:
🔗 Path: /logs
📜 Headers:
  content-type: application/json
  content-encoding: gzip
  accept-encoding: zstd,gzip,deflate,br
  user-agent: Vector/0.45.0-custom-bac0c2015 (aarch64-apple-darwin debug=full)
  host: localhost:8000
  content-length: 76
❌ Error: Gzip compression is not supported.
  127.0.0.1 - - [12/Feb/2025 11:10:22] "POST /logs HTTP/1.1" 400 -
So now the fix is obvious, we can change the compression and reload the Vector config:
compression: zlib
Reloading depends on the deployments e.g. systemctl kill -s HUP --kill-who=main vector.service.
You can read more in https://vector.dev/docs/administration/management.
Scenario 2 - Temporary Server Disruptions
Step 1
Run the server and the config. Notice that the component_sent_events_total metrics for sinks_0 is increasing during normal operation.
Step 2
Simulate rate limiting:
curl -X POST http://localhost:8000/set_status -H "Content-Type: application/json" -d '{"status": 429}'
Shortly after, observe this new Vector log:
2025-02-12T19:10:54.562556Z WARN sink{component_kind="sink" component_id=sink_0 component_type=http}:request{request_id=19}: vector::sinks::util::retries: Retrying after response. reason=too many requests internal_log_rate_limit=true
component_sent_events_total metric for sinks_0 has stopped increasing, and we are observing a 429 response status code.A sample metric demonstrating this:
{
  "name": "http_client_responses_total",
  "namespace": "vector",
  "tags": {
    "component_id": "sink_0",
    "component_kind": "sink",
    "component_type": "http",
    "host": "MY_HOST",
    "status": "429"
  },
  "timestamp": "2025-02-12T19:15:16.377709Z",
  "kind": "absolute",
  "counter": {
    "value": 41.0
  }
}
Here it is worth noting Vector will retry these failed requests based on the http sink
retry policy. This policy is defined for each sink
separately.
Step 3
Command the server to always respond with OK:
curl -X POST http://localhost:8000/set_status -H "Content-Type: application/json" -d '{"status": 200}'
Notice how the component_sent_events_total metrics for sinks_0 is now increasing again!
{
  "name": "component_sent_events_total",
  "namespace": "vector",
  "tags": {
    "component_id": "sink_1",
    "component_kind": "sink",
    "component_type": "console",
    "host": "MY_HOST"
  },
  "timestamp": "2025-02-12T19:14:56.377942Z",
  "kind": "absolute",
  "counter": {
    "value": 3678.0
  }
}
Scenario 3 - Smaller Batching
For this scenario, we will introduce a new limitation imposed by the server.
Also, assume Vector sets the maximum batch size to 10MB.
📥 Received POST request:
🔗 Path: /logs
📜 Headers:
   content-type: application/json
   content-encoding: deflate
   accept-encoding: zstd,gzip,deflate,br
   user-agent: Vector/0.45.0-custom-bac0c2015 (aarch64-apple-darwin debug=full)
   host: localhost:8000
   content-length: 1e+07
🗜️ Payload was zlib-compressed. Decompressed successfully.
📦 JSON Payload: [
  {
    "group": 0,
    "key": "a",
    "property": "foo"
  },
  {
    "group": 0,
    "key": "a",
    "property": "foo"
  },
  // Assume a lot more bytes...
],
❌ Error: Maximum payload size exceeded. Rejecting payloads over 8192 bytes.
Hmm, does Vector expose any relevant settings?
Yes, this behavior can be changed using batch settings!
We can add to significantly reduce the batch size:
    batch:
      max_events: 4
Final Config
👉 Click to view the whole config 👈
# version 3
api:
  enabled: true

sources:
  source_0:
    type: demo_logs
    format: shuffle
    lines:
      - '{ "key": "a", "property": "foo" }'
      - '{ "key": "b", "property": "bar" }'
    interval: 10

  source_1:
    type: demo_logs
    format: shuffle
    lines:
      - '{ "key": "c", "property": "some" }'
      - '{ "key": "d", "property": "another" }'
    interval: 10

  internal_metrics:
    type: internal_metrics
    scrape_interval_secs: 10

transforms:
  transform_0:
    type: remap
    inputs:
      - source_*
    source: |
      . = parse_json!(.message)
      if .key == "a" {
        .group = 0
      } else {
        .group = 1
      }

sinks:
  sink_0:
    inputs:
      - transform_0
    type: http
    uri: http://localhost:8000/logs
    encoding:
      codec: json
      json:
        pretty: true
    compression: zlib
    batch:
      max_events: 4

  sink_1:
    type: console
    inputs:
      - internal_metrics
    encoding:
      codec: json
      json:
        pretty: true
Now that we have a final configuration, we can also write Vector configuration unit tests.
Visualizing and querying internal metrics
Datadog Metrics
It is surprisingly simple to integrate Vector with the Datadog Metrics Explorer.
Step 1: Update the Vector config
sinks:
  sink_2:
    datadog_metrics:
      type: datadog_metrics
      inputs: ["internal_metrics"]
      api_key: "${DATADOG_API_KEY}"
Step 2: Navigate to the Datadog metrics explorer
- https://app.datadoghq.com/metric/explorer
- Use the UI to search for Vector metrics.
- Sample query:
sum:vector.component_sent_event_bytes_total{host:foo}.as_count()
- Sample query:
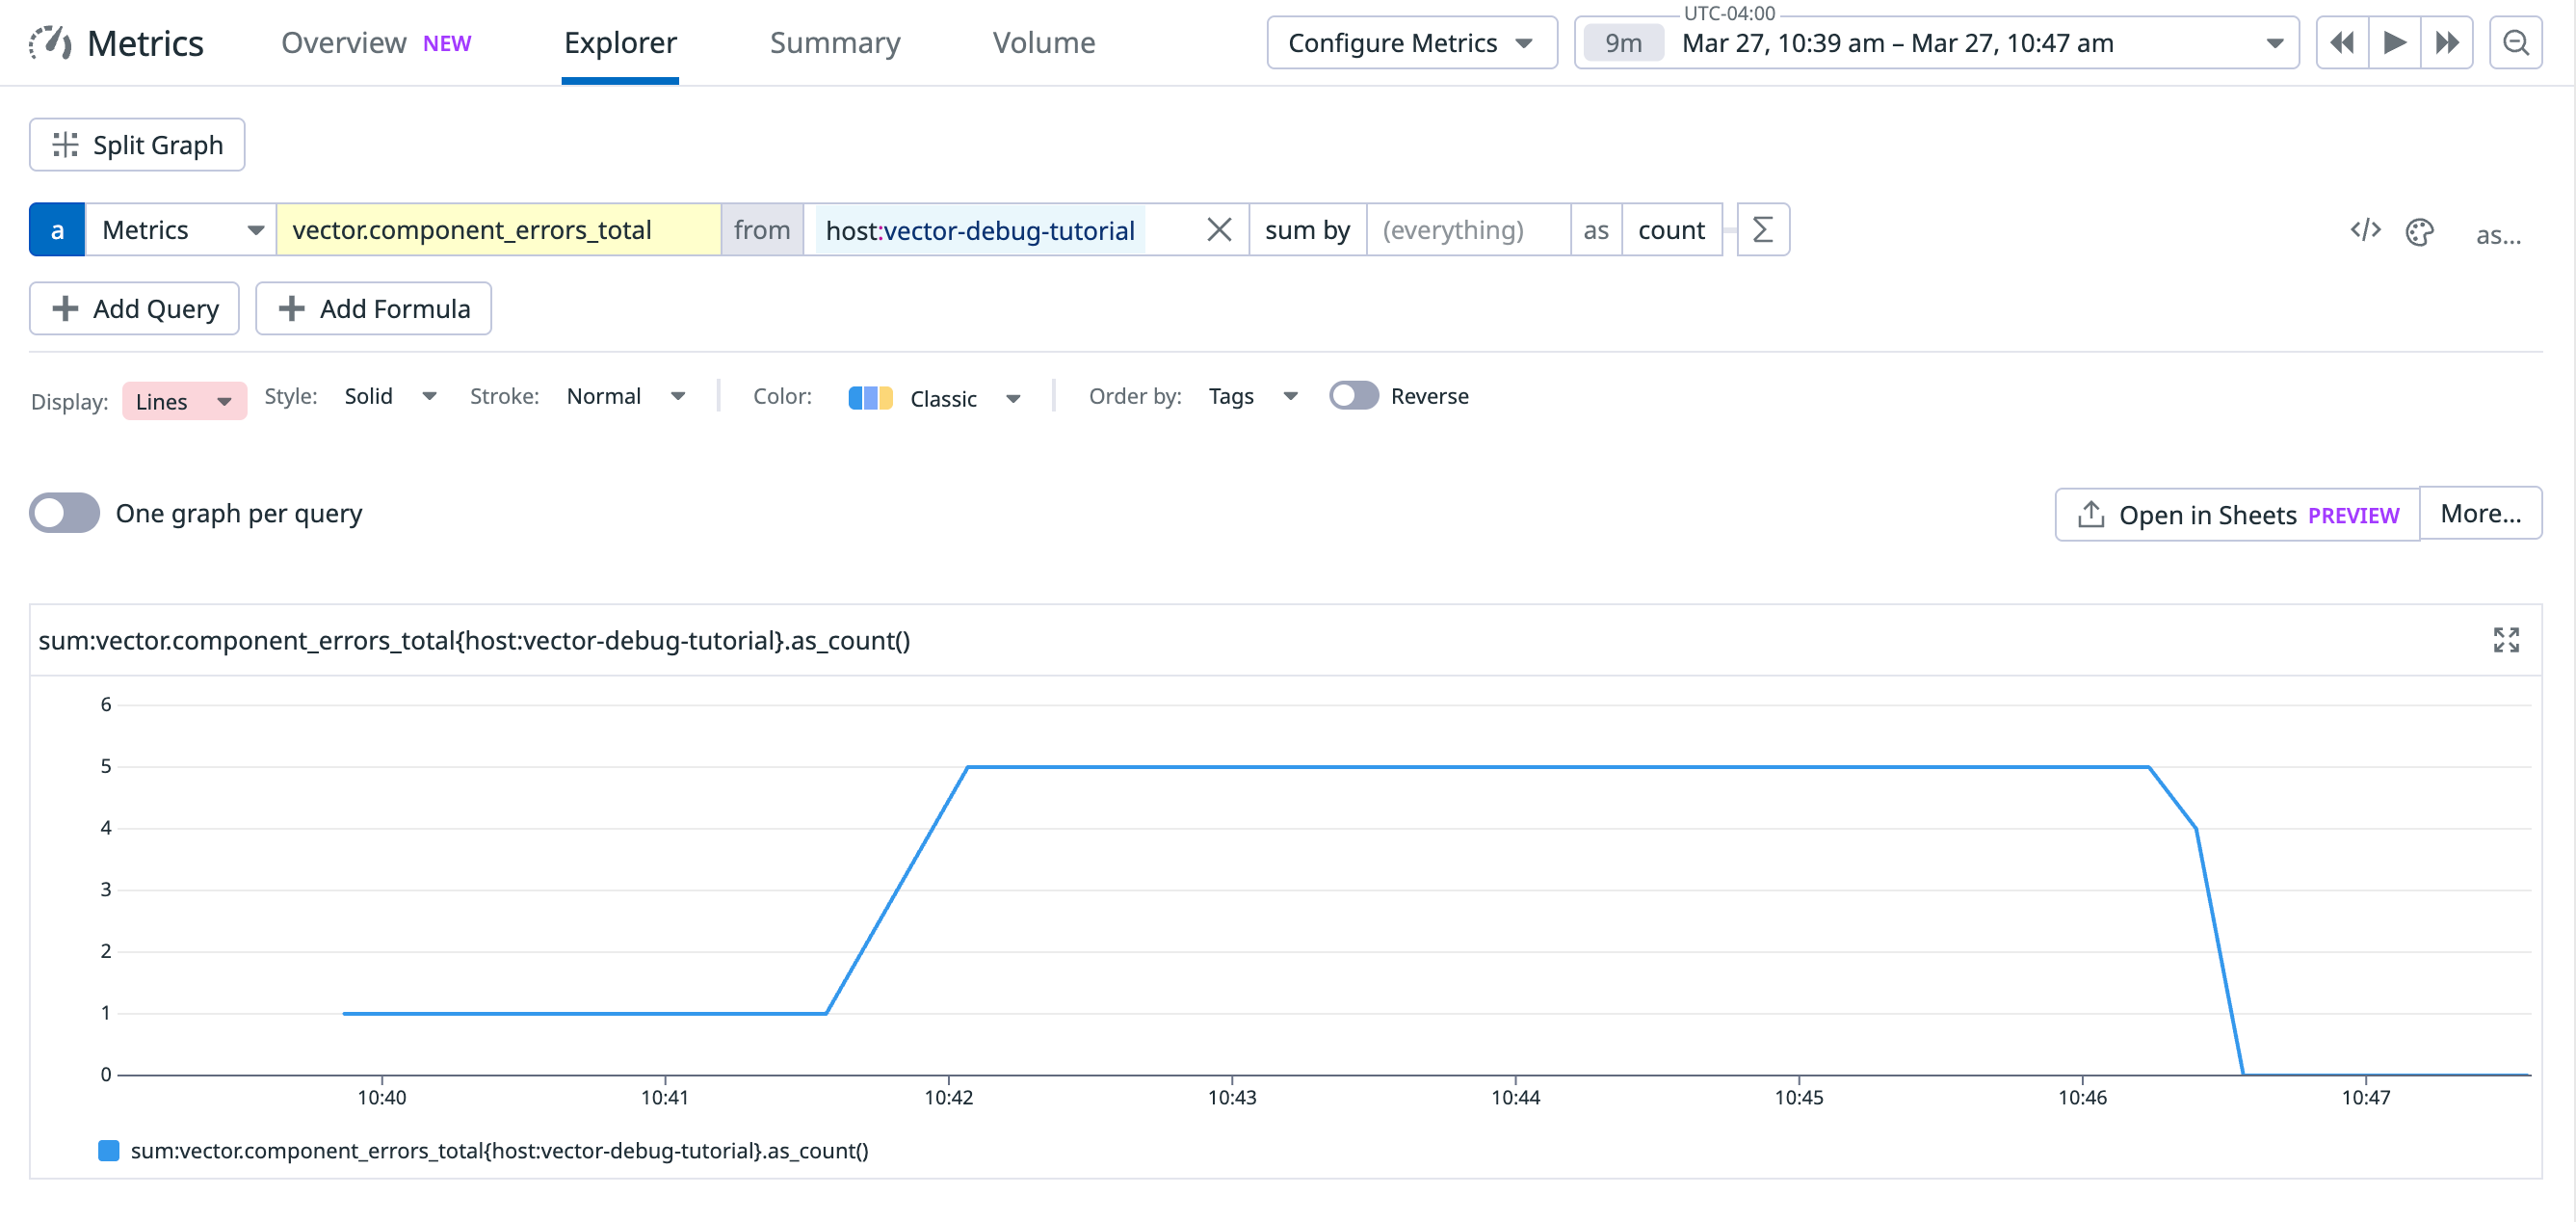
Prometheus and Grafana
We will use Docker Compose to start a Vector, Prometheus and Grafana instance.
Step 1: Update your Vector config
sinks:
  sink_2:
    type: prometheus_exporter
    inputs:
      - internal_metrics
    address: 0.0.0.0:9598
👉 Click to view the whole config 👈
# Vector config - version 4
api:
  enabled: true

sources:
  source_0:
    type: demo_logs
    format: shuffle
    lines:
      - '{ "key": "a", "property": "foo" }'
      - '{ "key": "b", "property": "bar" }'
    interval: 10

  source_1:
    type: demo_logs
    format: shuffle
    lines:
      - '{ "key": "c", "property": "some" }'
      - '{ "key": "d", "property": "another" }'
    interval: 10

  internal_metrics:
    type: internal_metrics
    scrape_interval_secs: 10

transforms:
  transform_0:
    type: remap
    inputs:
      - source_*
    source: |
      . = parse_json!(.message)
      if .key == "a" {
        .group = 0
      } else {
        .group = 1
      }

sinks:
  sink_0:
    inputs:
      - transform_0
    type: http
    uri: http://host.docker.internal:8000/logs
    encoding:
      codec: json
      json:
        pretty: true
    compression: zlib
    batch:
      max_events: 4

  sink_1:
    type: console
    inputs:
      - internal_metrics
    encoding:
      codec: json
      json:
        pretty: true

  sink_2:
    type: prometheus_exporter
    inputs:
      - internal_metrics
    address: 0.0.0.0:9598
Step 2: Prometheus configuration
# prometheus config
global:
  scrape_interval: 15s

scrape_configs:
  - job_name: "vector"
    static_configs:
      - targets: ["host.docker.internal:9598"]
Step 3: Docker Compose configuration
Use the following template and replace with the actual paths:
# docker-compose.yaml
services:
  vector:
    image: timberio/vector:0.45.0-debian
    container_name: vector
    ports:
      - "9598:9598"
    volumes:
      - <path to Vector config here>:/etc/vector/vector.yaml
    networks:
      - vector-net

  prometheus:
    image: prom/prometheus:latest
    container_name: prometheus
    ports:
      - "9090:9090"
    volumes:
      - - <path to Prometheus config here>:/etc/prometheus/prometheus.yml
    networks:
      - vector-net

  grafana:
    image: grafana/grafana:latest
    container_name: grafana
    ports:
      - "3000:3000"
    networks:
      - vector-net
    environment:
      - GF_SECURITY_ADMIN_PASSWORD=admin
    depends_on:
      - prometheus

networks:
  vector-net:
    driver: bridge
Step 4: Setup Grafana
- Login to Grafana with username
adminand passwordadmin - Navigate to connections/datasources/
- Add the Prometheus datasource with the following URL:
http://host.docker.internal:9090. If you are having trouble with this step, please read this guide. - Create a Grafana dashboard
- All Vector internal metrics with have the
vector_prefix - For example, you can visualize
vector_component_errors_totalandvector_component_discarded_events_total. - You can take it further and alert with
increase(vector_component_discarded_events_total[5m])
- All Vector internal metrics with have the
Note that this guide is meant as a starting point. I recommend saving your Grafana datasources and
dashboards and including them as volumes in your docker-compose.yaml.