Introducing vector top
A CLI dashboard interface for monitoring Vector instances.

vector top is a command for the Vector CLI that displays both metrics emitted by your Vector instance as well
as information about your Vector topology through a beautiful dashboard-style interface reminiscent of tools like
htop. To use it, run vector top and specify the URL of the running Vector instance you want to monitor:
vector top --url https://my-vector-instance.prod.acmecorp.biz
That pulls up an interface that looks like this:
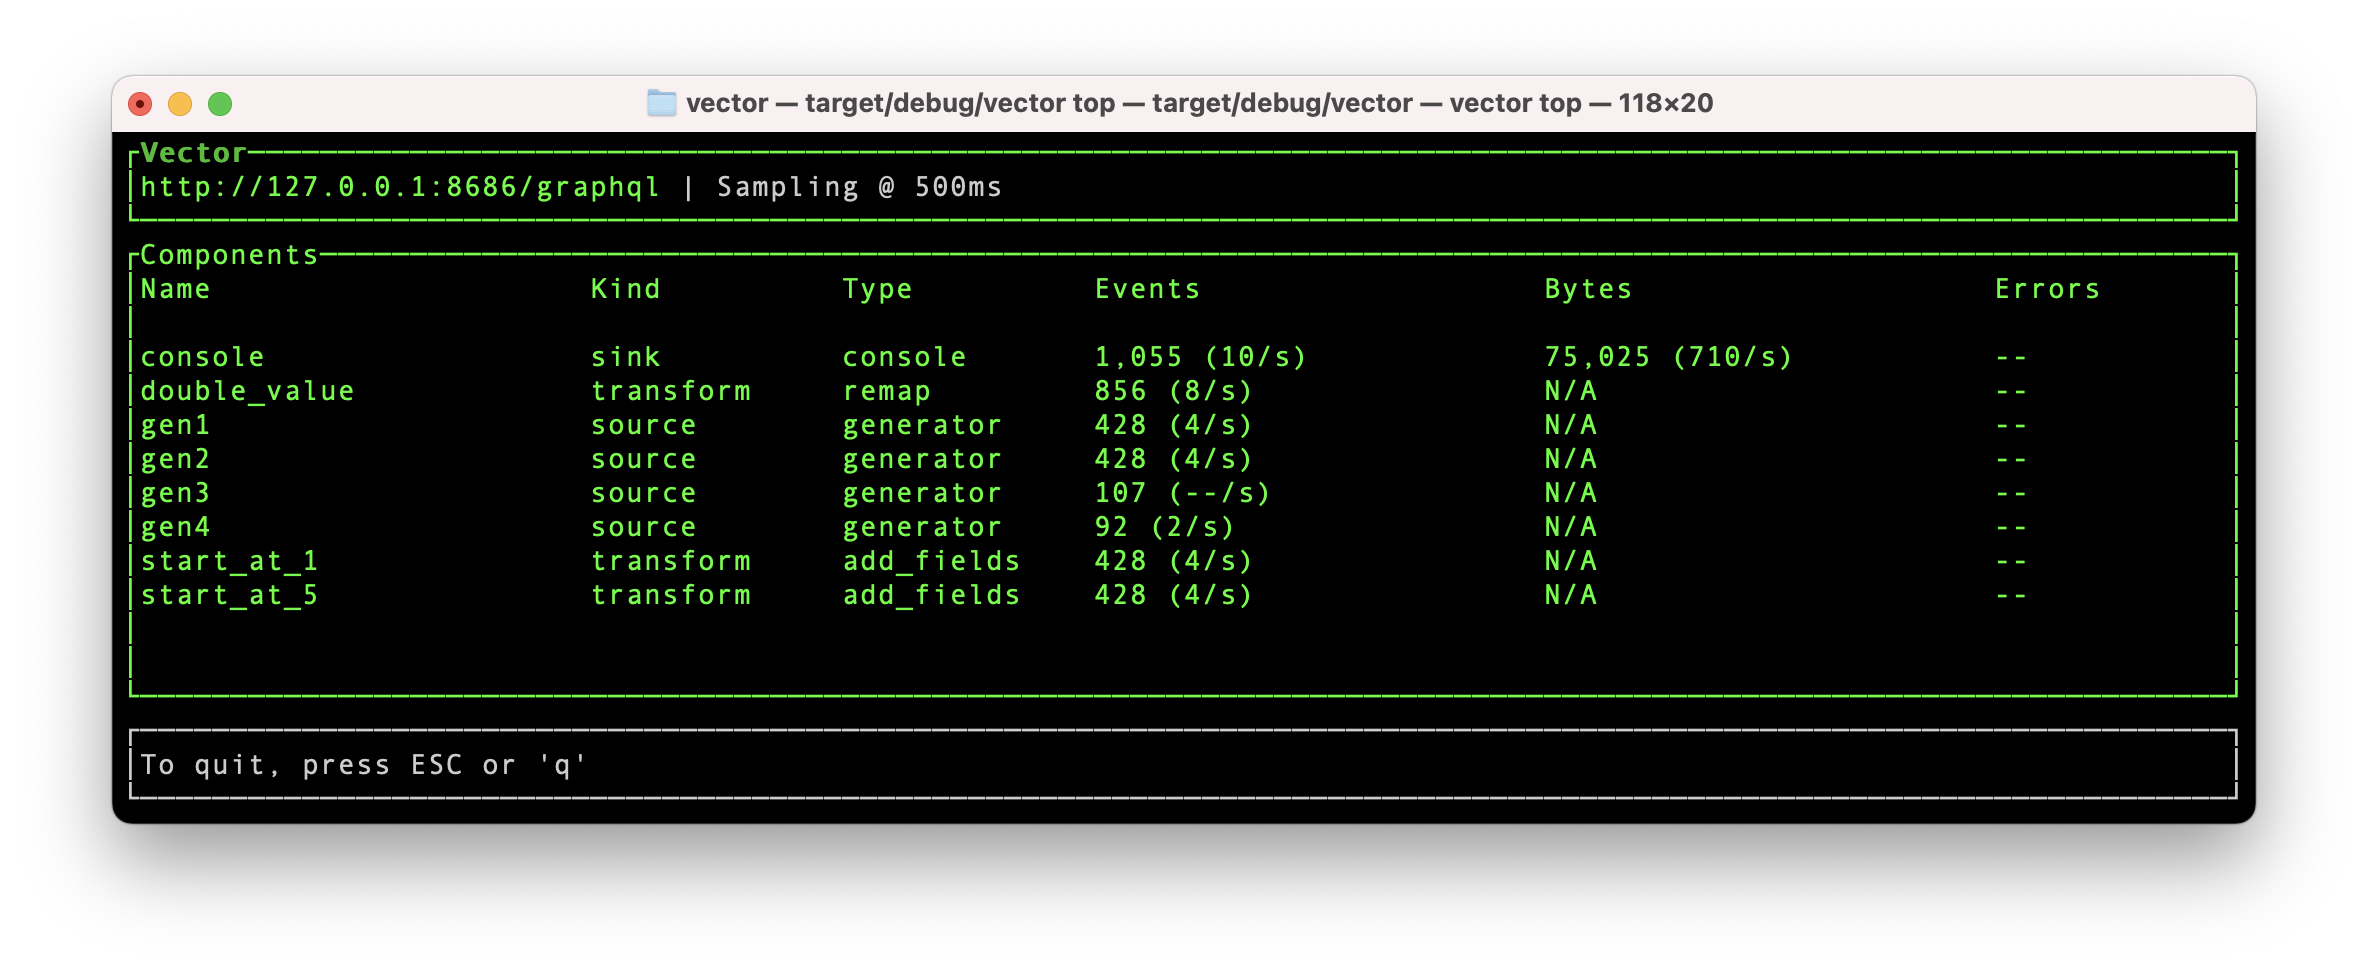
By default, the vector top looks for a Vector instance running locally at http://localhost:8686, but you can also
monitor remote instances, as in the example above. The information displayed updates every second by default, but you
can adjust that using the --interval flag.
Architecturally, vector top interacts directly with Vector’s GraphQL API, which was built with vector top as
a primary consumer. The dashboard UI was created using the excellent [tui-rs] library.