Visualizing your Vector topology
Introducing the new graph CLI subcommand for outputting your Vector topology as a graph

This release adds a new subcommand vector graph to output the topology specified by you Vector configuration as
a graph in DOT format. This output can then be visualized using Graphviz to produce an image.
For example, if you had a config, vector.yaml, like:
##
## Sources
##

sources:
  internal_metrics:
    type: "internal_metrics"

  dd_logs:
    type: "datadog_logs" # required
    acknowledgements: false # optional, default
    address: "0.0.0.0:8282" # required

  file_gen:
    type: "file"
    include: ["/var/log/file_gen/**/*.log"]
    read_from: "beginning"

##
## Transforms
##

transforms:
  remap:
    type: "remap"
    inputs: ["file_gen"]
    source: |
      .agent_name = "vector"
      parsed, err = parse_json(.message)
      if err == null {
          .message = parsed
          .format = "json"
      } else {
          .format = "ascii"
      }
      matches = parse_regex!(.file, r'.*/(?P<num>\d+)-(?P<name>\w+).log')
      .origin, err = .host + "/" + matches.name + "/" + matches.num
      if err != null {
          log("Failed to parse origin from file name", level: "error")
      }

##
## Sinks
##

sinks:
  prometheus:
    type: "prometheus_exporter"
    inputs: ["internal_metrics"]
    address: "0.0.0.0:9598"

  dd_logs_egress:
    type: "datadog_logs"
    inputs: ["dd_logs"]
    default_api_key: ""
    encoding:
      codec: "json"
    request:
      concurrency: "adaptive"
      rate_limit_num: 1000
    batch:
      max_bytes: 5242880

  blackhole:
    type: "blackhole"
    inputs: ["remap"]
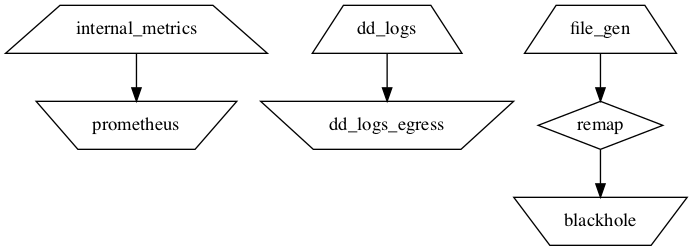
And you ran the new vector graph --config vector.yaml you would see:
digraph {
  "internal_metrics" [shape=trapezium]
  "dd_logs" [shape=trapezium]
  "file_gen" [shape=trapezium]
  "remap" [shape=diamond]
  "file_gen" -> "remap"
  "prometheus" [shape=invtrapezium]
  "internal_metrics" -> "prometheus"
  "dd_logs_egress" [shape=invtrapezium]
  "dd_logs" -> "dd_logs_egress"
  "blackhole" [shape=invtrapezium]
  "remap" -> "blackhole"
}
To render this, if you have Graphviz installed, you could do:
vector graph --config vector.yaml | dot -Tpng > graph.png
To get an image that looks like:
If you don’t have Graphviz installed, you can also visualize online at webgraphviz.com.